The world is going digital, and so are our wallets.
The increasing adoption of mobile app development services by businesses has brought a revolutionary wave of advancements in every single task people do in their day-to-day lives. While talking about the developments, we can’t deny the growth of the mobile payment industry.
Mobile payments are changing the way we shop, dine, and even transact. From the busy streets of cities to quiet rural towns, smartphones are becoming our new money-handling tools. Join us as we dive into the exciting world of mobile payments to explore the latest statistics and trends that shape commerce’s future.
Mobile Payment Industry- Market Size, Statistics, & Reports in 2025
The global mobile payment market was also predicted to reach US$221.93 billion by 2030, with a 15.0% CAGR from 2023 to 2030. Based on the statistics, m-pay will be the most used method worldwide in the coming years.
Below, we have rounded up the complete mobile payment statistics to assist businesses in understanding the payment landscape in 2024. If you are looking to hire a mobile app development company to get an efficient payment solution, you must check below stats-
Key Takeaways for Mobile Payment (M-Payments) Over the Years
According to Grandview Research, the global mobile payment market size is expected to reach USD 587.52 billion by 2030, growing at a CAGR of 38.0% from 2025 to 2030.
- The booming mobile payment market is expected to evolve at a 36.2% CAGR between 2023 and 2030 (GrandViewResearch).
- The total global mobile transaction value was $2.2 trillion in 2023.
- In 2022, the global mobile payment market was valued at US$67.26 billion, and it is predicted to be US$221.92 billion by 2030, with a 15% CAGR from 2023 to 2030.
- The volume of mobile payment transactions reached $2.1 billion in the year 2024, which was a 27% increase compared to 2020 (tech. co).
- There is a growth in mobile payment use by 26.63% between the years 2020 and 2025.
- By 2024, the worldwide mobile payment market is forecasted to be at 3 Trillion.
- By 2025, the user base for mobile payments worldwide is estimated to be 3.8 billion.
Mobile Payment Stats as per Global Market Share
The demand for mobile payment has increased significantly during and after the pandemic compared to previous years, and according to a recent survey by Octal IT Solution, mobile payment systems and digital wallets witnessed substantial growth in 2025, with the Asia-Pacific region leading the charge, contributing 50% of digital payment transactions worldwide.
Furthermore, technological enhancements, government efforts, and the rising e-commerce industry will drive the global mobile payment market’s CAGR of over 14% between 2023 and 2030, according to an Allied Market Research analysis.
- The Global Mobile Payments Market was valued at US$43.11 billion in 2021 and US$55.34 billion in 2022. According to CMI (Custom Market Insights), it is expected to be US$587.52 billion by 2030.
- The mobile payment industry is anticipated to grow with an expected CAGR of 26.93% from 2020 to 2025.
- The mobile payment market worldwide is projected to grow at a 23.8% annual rate between 2021 and 2026.
- In 2020, 44.5% of eCommerce transactions were done by digital wallets.
- A survey done by Octal IT Solution recorded growth in the overall number of mobile proximity payment users in the USA, which surpassed 100 million in 2021 and is projected to grow to 125 million by 2025.
- The global mobile payment market was valued at US$2.98 trillion in 2023 and is estimated to increase from US$3.84 trillion in 2024 to US$27.81 trillion by 2032, at a 28.2% CAGR between 2024 and 2032.
Mobile Payment Stats as per User Segment
As of 2025, global mobile payment users were recorded as 18 and 45 years old, and they are more likely to use mobile payment apps compared to other age groups. As per the Octal IT Solution survey, the ratio is:
- 18 to 34 – 78%
- 35 to 44 – 69%
- 45 to 64 – 48%
- 65+ – 31%
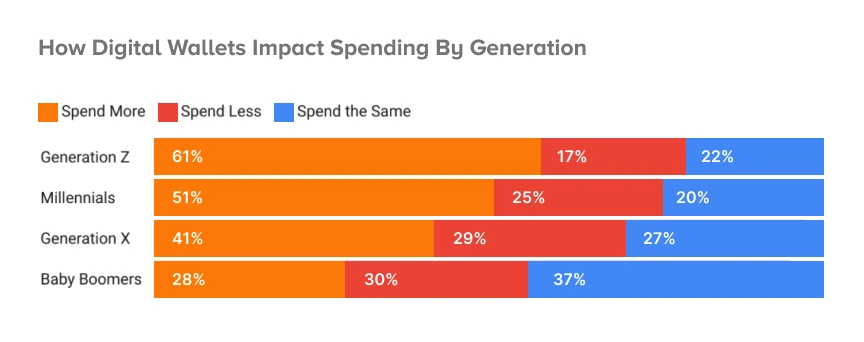
People of every age enjoy the benefits of mobile payments, eWallets, crypto wallets, and QR codes. Given their popularity, various businesses are entering this industry by obtaining eWallet development services. They have witnessed the spending habits of Gen Z and millennials and hence know about the included profits.
Below, you can see the significant impact of mobile payment systems based on different generations-
Visit Also: Key Mobile Commerce Statistics and mCommerce Shopping Trends
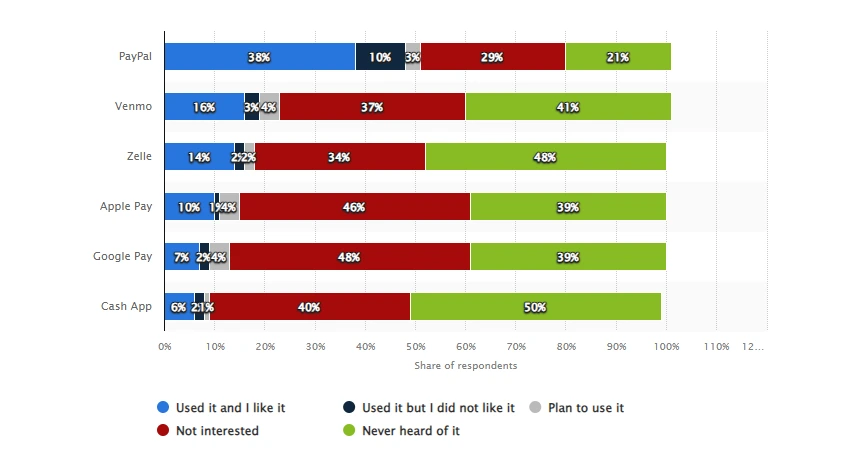
Mobile Payment Statistics: Most Popular Mobile Payment Apps
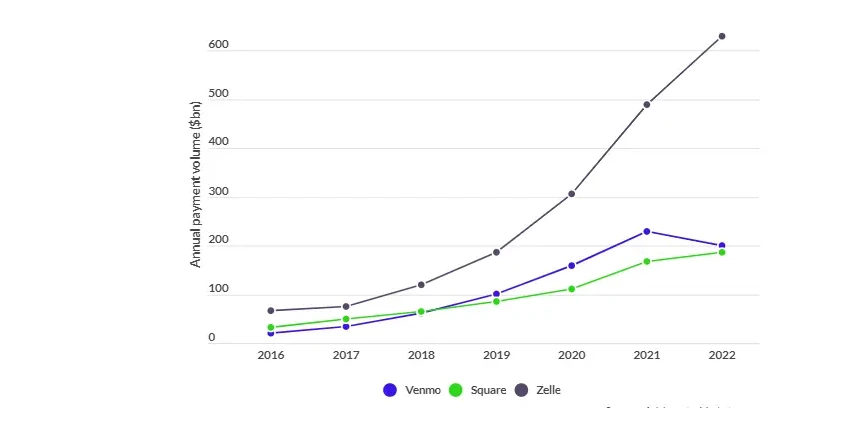
- A survey in the USA conducted by Octal IT Solution in January 2021 found that five times more respondents preferred PayPal over Apple Pay. Some popular mobile payment apps, such as Venmo, Zelle, Google Pay, Cash App, and others, were created by leading eWallet development companies and primarily chosen by users in the USA.
- A wide range of mobile payment apps have been in the market and have impacted it highly. See the statistics between 2016 and 2022-
- The mobile payments growth will continue to upsurge in the future by overtaking card and cash payments by 2025.
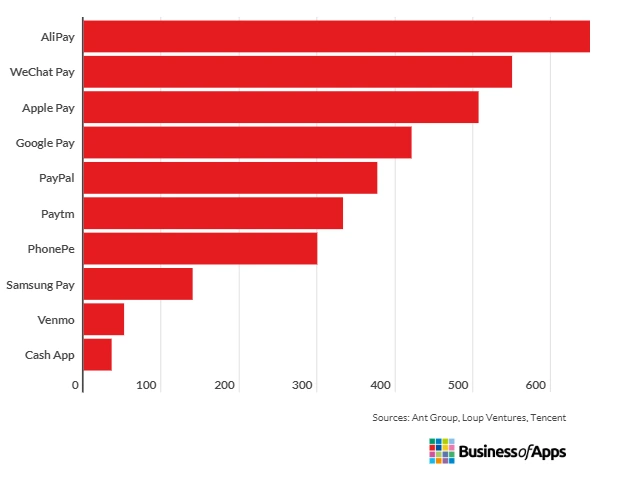
- In 2022, AliPay, WeChat Pay, and Apple Pay emerged as global giants in the mobile payment industry.
- In the USA, PayPal is the leading mobile payment method, followed by Apple Pay, cash apps, etc.
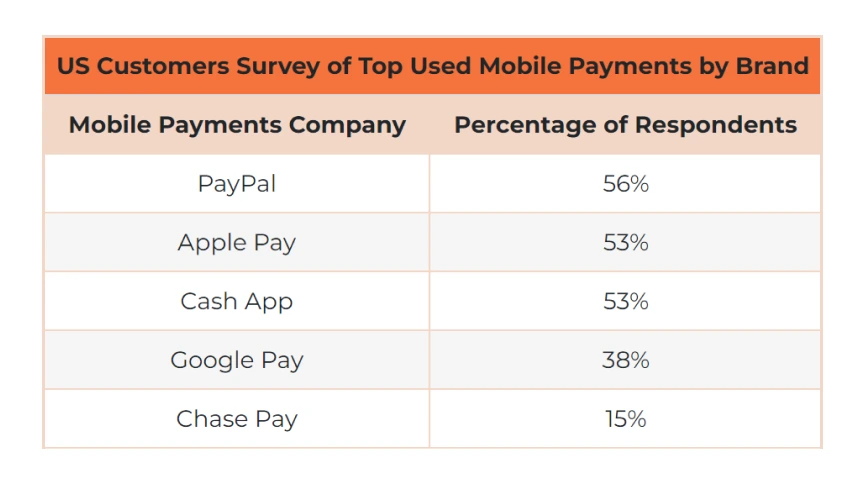
- According to the Octal IT Solution survey, 56% of USA users agreed to leave cash at home and use mobile payment methods.
- The overall transaction value of digital payments in the USA is projected to be $3,073 billion in the year 2024.
- The USA market for digital payments is forecasted to grow at a 14.66% CAGR to reach $4,620 billion by 2028.

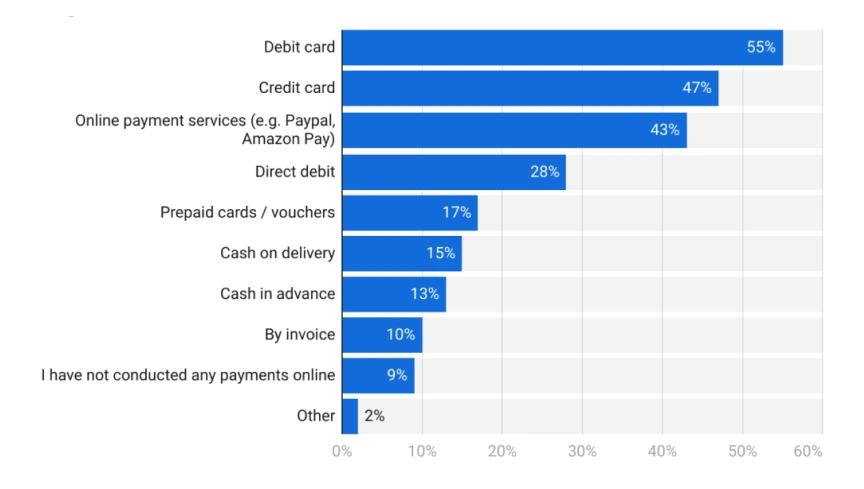
Mobile Payment Statistics: Most Common Types of Online Payments
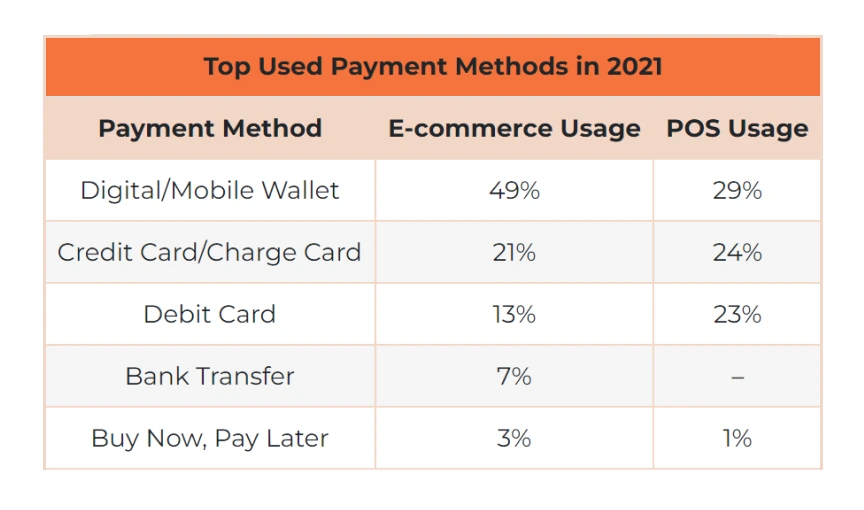
- While choosing an ewallet app development company for mobile payment apps, you need to select different payment methods to include in your online payment app, which is preferred by a large base of users. Here are the top-used payment methods in 2021-
- As of 2023, in the USA, the most common online payment methods were debit cards, used by around 55% of users. This was followed by Credit card users, and then there were online payment services, used by 43% of users.
1. QR Code Statistics
- According to a report generated by Octal IT Solution, QR code payments are predicted to grow by 25% from the year 2022 to 2025, attaining a value of $3 trillion.
- The QR code payment has risen 11% in the United States since the COVID-19 pandemic.
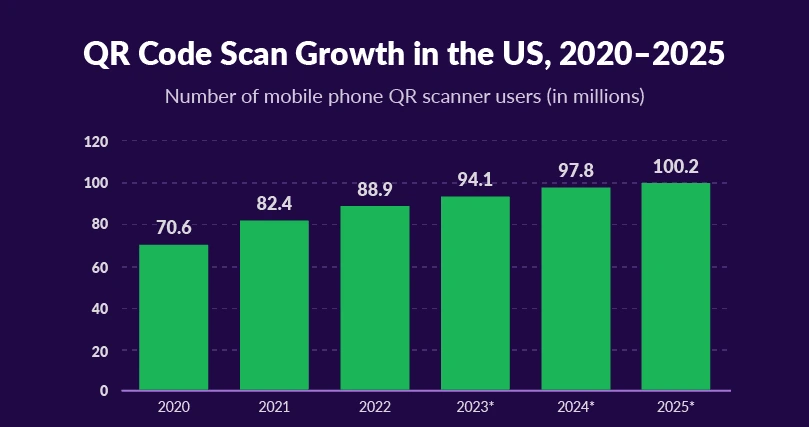
- The use of QR code scanners is anticipated to exhibit sustained growth, reaching more than 100 million US users by 2025.
- A QR code can encode binary data, symbols, control codes, alphabetical, kanji, hiragana, katakana, and numeral characters.
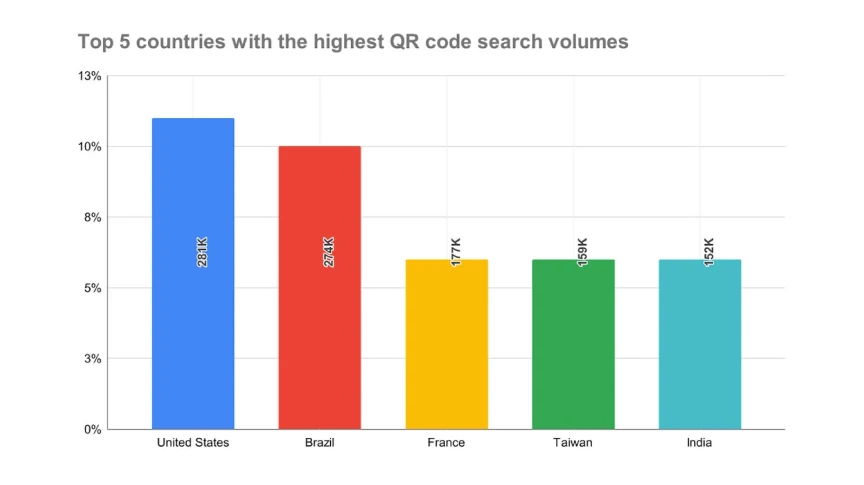
- The top five countries, including the USA, Brazil, France, Taiwan, and India, contain the highest QR code search volumes.
- QR code payment transactions might grow to $2.27 trillion globally by 2025.
- 5% of users choose QR codes for payments when they don’t have cash.
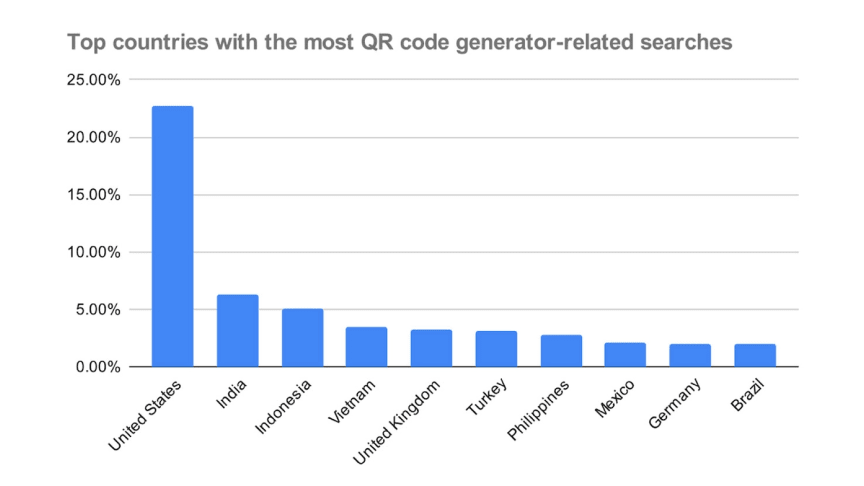
- The top countries with the most QR code generator-related searches include the USA, India, Indonesia, Vietnam, etc.
2. eWallet or Mobile Wallet Statistics
- Mobile wallet payments accounted for 5% of all online transactions.
- Research has found that millennials are more likely to pay through mobile payments.
- According to a study, the mobile wallet market can reach $80 billion by 2026.
- Research found that 66% of people find mobile payments more suitable than other payment methods.
- The adoption rate of mobile payments is relatively high in countries like India, South Korea, and China.
- Mobile phones are accountable for 40% of all online transactions.
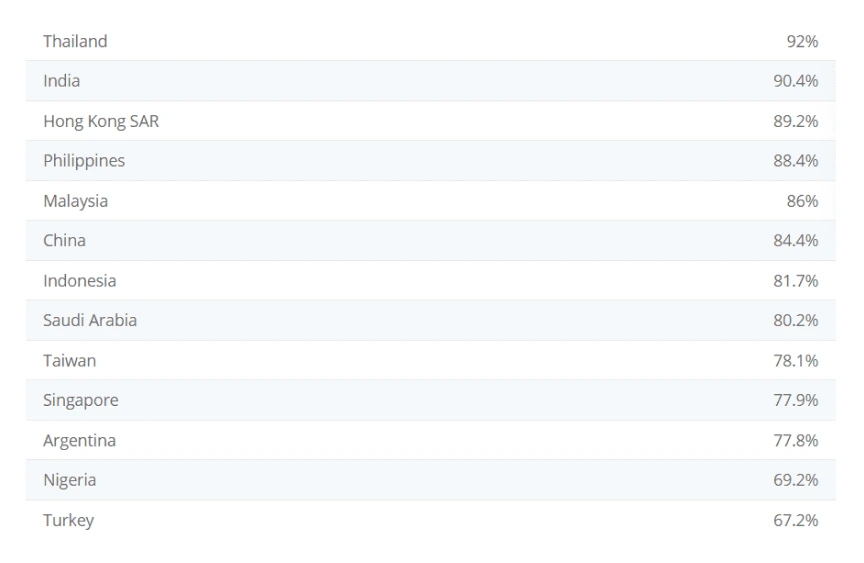
- Below, you can find the share of respondents who indicated they used a mobile wallet in different countries and territories worldwide in 2022.
- Mobile wallets will comprise more than half (51.7%) of global e-commerce payment preferences by 2024.
- Mobile wallets are currently the leading choice for payments in the Asia-Pacific region and are projected to make up 47.9% of point-of-sale transactions by 2024.
- In 2020, mobile payments constituted 21.0% of the total volume of global e-commerce transactions, yet they represented only 12.0% of the total transaction value.
- Mobile payments are projected to increase from $502 billion in 2020 to $755 billion in the USA by 2024.
- As indicated by the study and reports of Worldpay Report 2021, mobile payments are anticipated to reach a global total of $38.0 trillion in 2025.
- The BPNL (Buy Now, Pay Later) market is steadily gaining a larger portion of the global market share, with expectations that it will double from 2.1% in 2020 to 4.2% by 2024.
3. Crypto Wallet Statistics
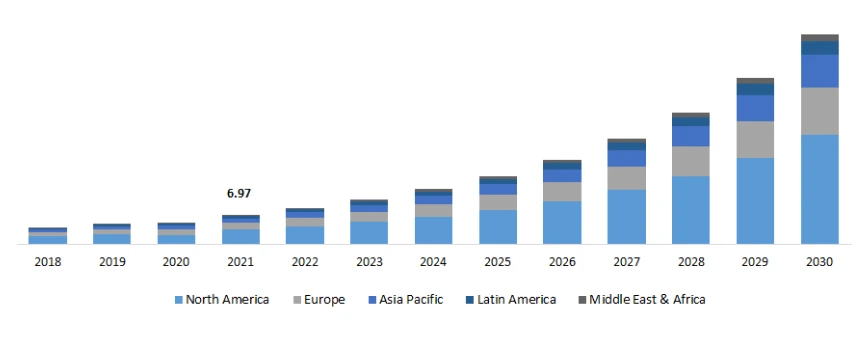
- Are you looking for a crypto wallet development company? At present, various businesses seek crypto wallet development services, looking at their established market worldwide, valued at US$6.97 billion in the year 2021, which is predicted to escalate at 24.31% CAGR.
- The increased use of crypto upscaled the market globally to 84.02 million users in 2022, which increased from 76.32 million in 2021.
- The overall crypto wallet market is estimated to reach $3.9 billion by 2028, escalating at a 12.8% CAGR from 2023 to 2028.
- According to a survey by Octal IT Solution, cryptocurrency wallets account for around 25% of Bitcoin sales.
- The worldwide crypto wallet market was valued at US$1470.9 million in 2021 and is forecasted to reach US$25936.8 million by 2032 at a 29.81% CAGR.
- The global crypto wallet market was valued at US$8.42 billion in 2022 and is estimated to escalate at a 24.8% CAGR from 2023 to 2030 (GrandViewResearch).
Prominent Countries in Digital Payments
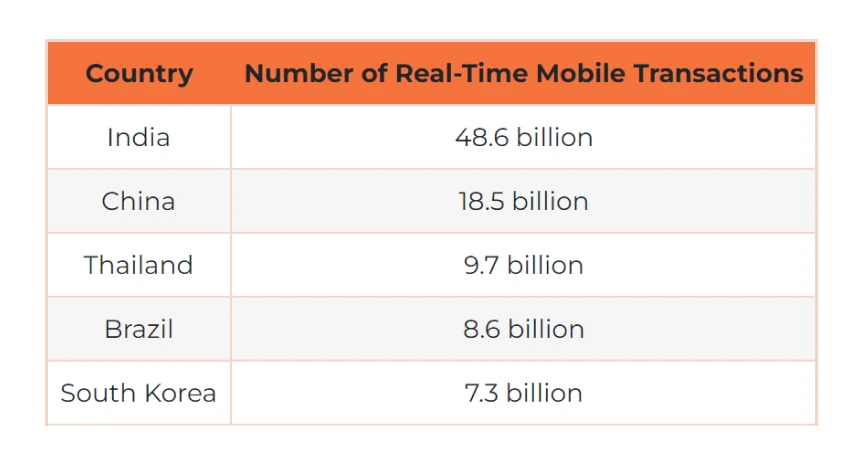
- Below, we have represented country-wise digital payment statistics, showing that India is leading with 48.6 billion real-time mobile transactions, followed by China, Thailand, etc.
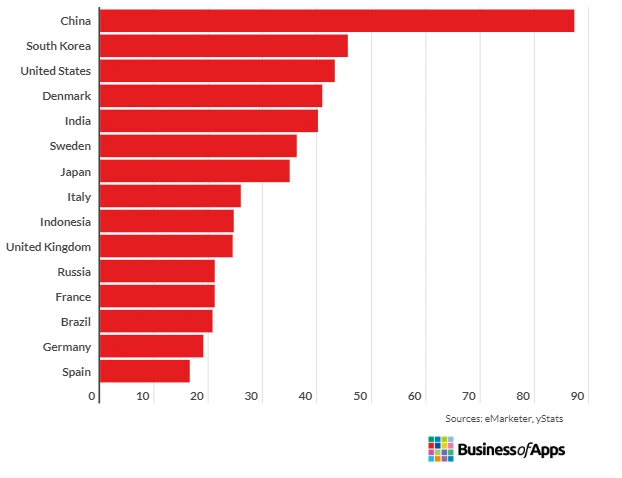
- By far, China has the highest adoption rate for mobile payments, mainly QR codes, followed by South Korea, the USA, Denmark, and India.
- In the USA, people more often use Apple Pay as their preferred mobile payment method; hence, the numbers have grown to 43.9 million.
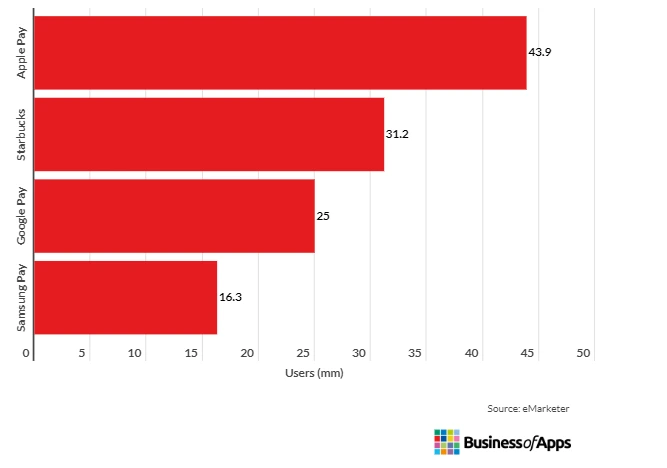
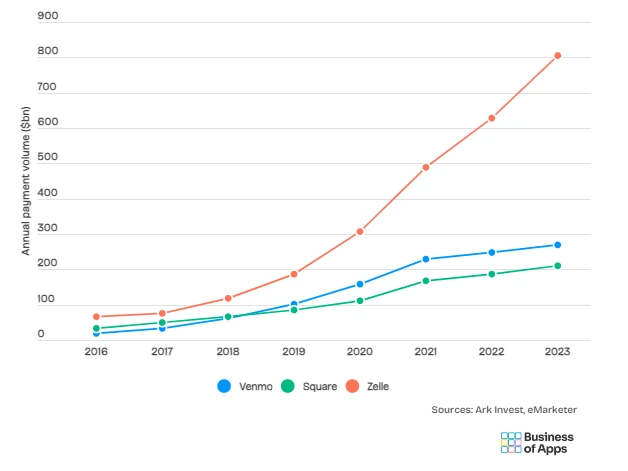
- People in the USA also use a cooperative mobile app owned by big banks, surpassing mobile payment apps like Square and Venmo in total payment volume.
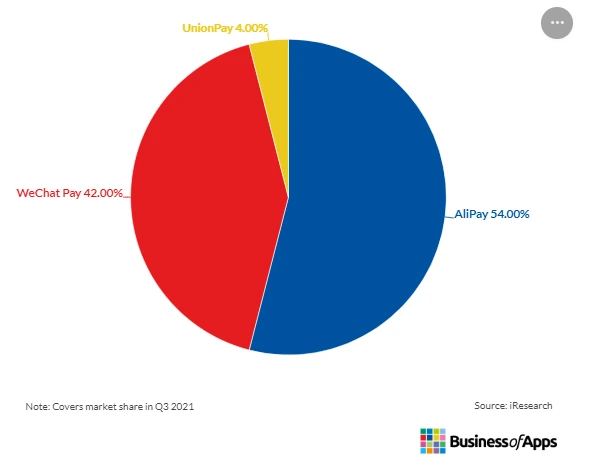
- In China, AliPay and WeChat rule all over the country with the highest numbers.
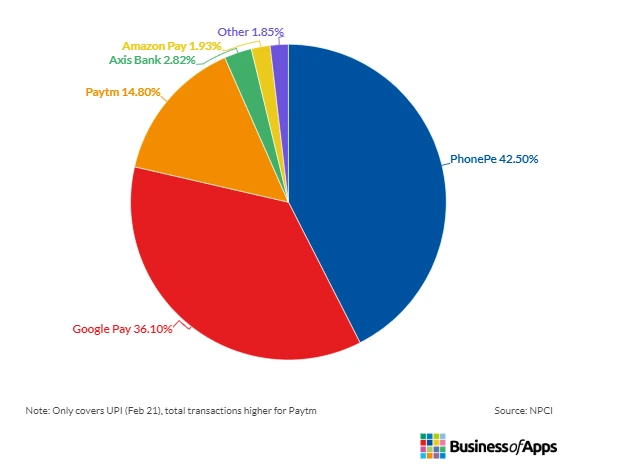
- In India, PhonePe and GooglePay have the highest number of users, followed by Paytm, Axis Bank, AmazonPay, etc.
Mobile Payment Statistics by Different Regions
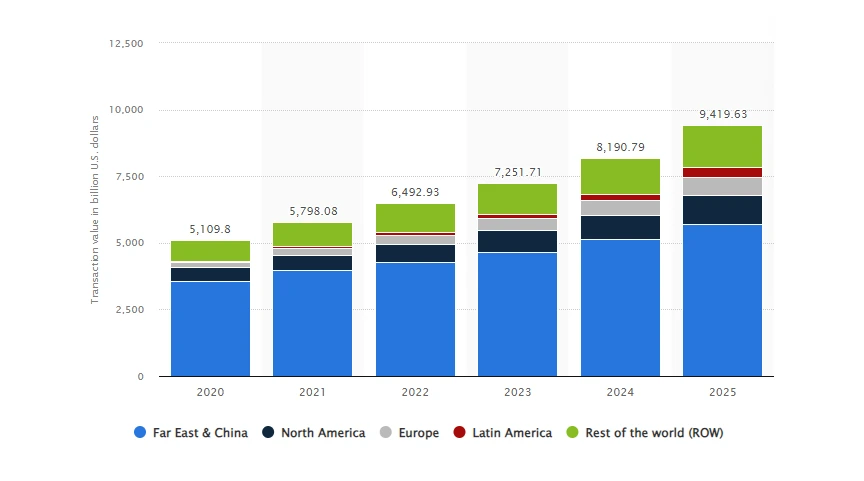
- The above statistics represent the vast market size of mobile wallet transactions in different regions worldwide in 2020, with a forecast from 2021 to 2025.
- Check out mobile payment statistics worldwide, in Asia, America, Europe, and Africa. Here it is-
(Worldwide)
- The global mobile Point of Sale payments are forecasted to grow to $3.78 Trillion in 2024.
- The overall transaction value is predicted to mount at a 13.45% CAGR, growing to $5.52 Trillion between 2024 and 2027.
- Considering the worldwide evaluation of mobile POS payments, China’s highest transaction value is forecasted to be $1,721 billion in 2024.
- The regular transaction value per person is likely to be $2.25k.
- By 2027, the overall number of mobile POS Payment users is expected to grow to 1.9 billion.
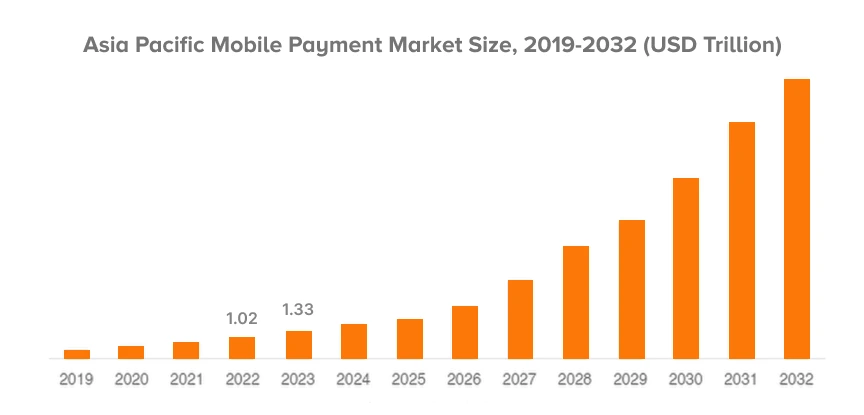
(Asia)
- The average transaction value per person in the Asian Mobile POS payments market is anticipated to be $1.64k in 2024.
- Additionally, the Asian mobile POS Payments market is predicted to reach $2.00 trillion, increasing at a 10.25% CAGR and attaining $2.68 trillion by 2027.
- The complete number of users in the market will grow to 1.4 billion by 2027.
(America)
- The American Mobile POS Payments market is estimated to be worth $0.98 trillion in 2024 and is projected to grow at a 17.01% CAGR, reaching 1.57 trillion by 2027.
- The average transaction value per person is $5.40k in the year 2024.
- The overall number of users in the same market is estimated to grow to 219.9 million by 2027.
(Africa)
- The African Mobile POS Payments market is anticipated to reach $158.60 billion by 2027, developing at a 17.74% CAGR compared to the current estimated $97.18 billion.
- The average transaction per person value will grow to $0.76k in 2024.
- Besides, the total number of users is projected to reach 169.2 million by 2027.
(Europe)
- Currently, the average transaction value per user in the European market is predicted to be $4.35k.
- Moreover, the total number of users is estimated to reach 170.1 million by 2027.
- The European Mobile POS payments market is currently cherished at $648.10 billion and is anticipated to reach 15.82%, escalating at a 15.82% CAGR.
Mobile Payment Security Statistics
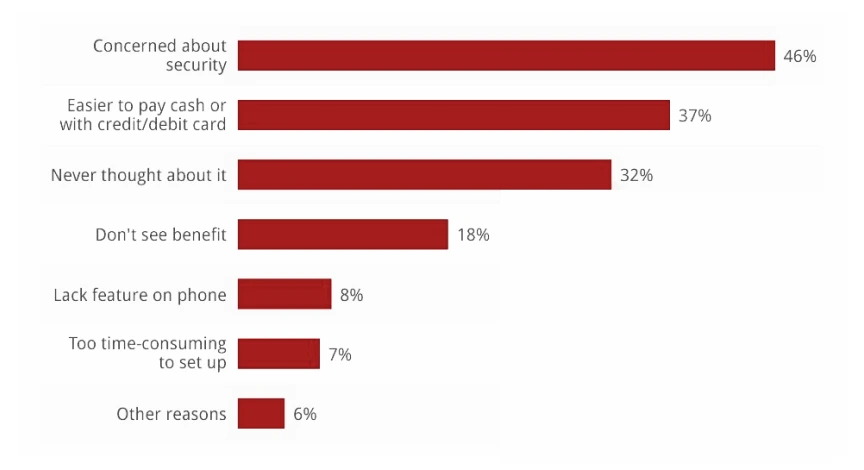
Most people consider mobile payment applications a convenient and secure method to transfer money. However, there are US citizens with a completely different mindset. The research was conducted on US consumers who don’t use mobile payments. Here are their reasons.
- 46% of the non-users of mobile payment have security concerns.
- 37% believe paying through cash, debit, or credit card is much easier.
- 18% of the segment does not see any benefit.
- 7% think setting up an account on mobile payment applications is time-consuming.
- The remaining ones have other reasons for not considering mobile payments.
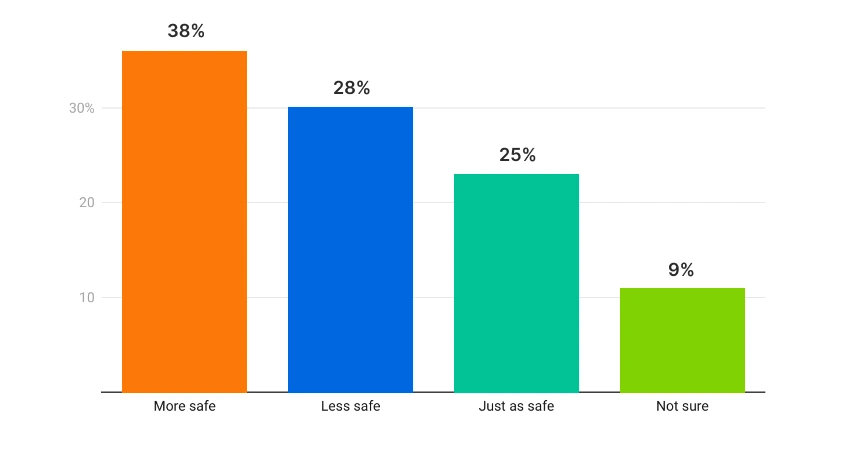
- Octal IT Solution conducted a survey to determine how safe digital payments are in the view of users. We found 38% of respondents consider digital payments to be safer than traditional payment methods, while 28% stated they find digital payment methods less safe. 25% said the safety of both methods is equally important to them, whereas 9% of respondents were unsure about both methods.
Read More: Top Artificial Intelligence Statistics and Facts
Why Users Prefer to Use Mobile Payments or Digital Wallets?
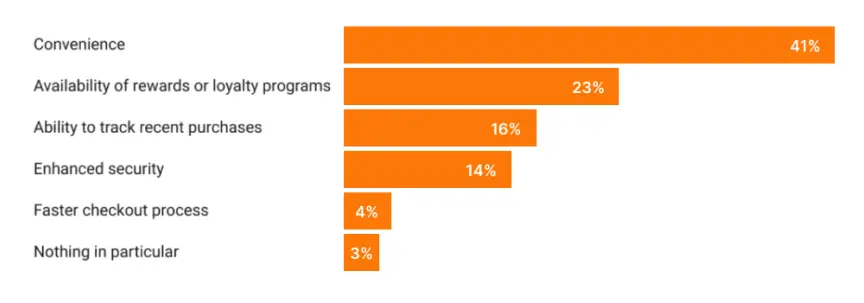
As of 2025, users are choosing digital wallets for several major reasons, including convenience, loyalty programs, better security, etc. Some are using them to track their recent purchases, and some are using them for faster payment processing.
Wrapping It Up
Here comes the end of this insightful article; we hope the above-mentioned mobile payment statistics and facts have helped you understand the potential of generating profits in this particular industry.
Therefore, if you have any app ideas around mobile wallets or payments, feel free to contact us for free consultancy. Octal IT Solution is a top mobile app development services provider that delivers quality digital payment solutions.
Our professionals will provide you with consultation while pinpointing areas of improvement. Octal IT Solution delivers the best services with 15+ years of expertise in shaping and turning incredible app ideas into reality.


 By
By January 1, 2025